|
Projects Download sample project files and reports HERE GO BACK to resume |
|
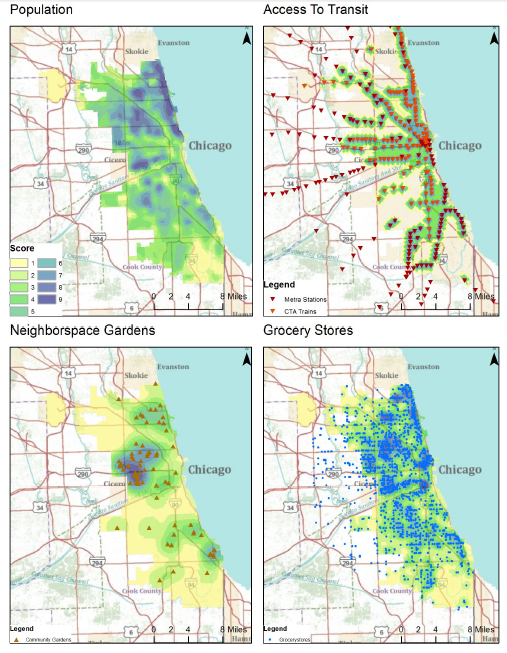
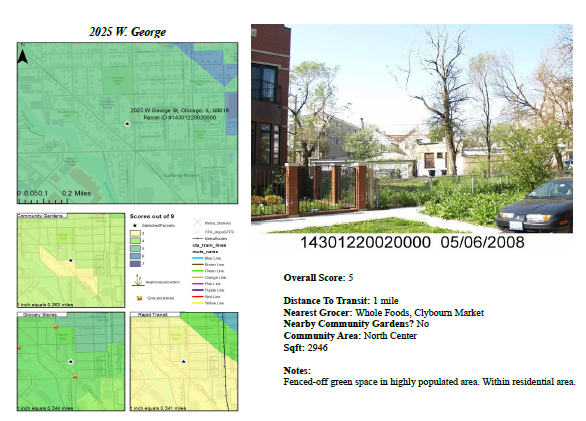
Site Selection for Urban Agriculture |
Empowering communities with GIS Using GIS technology to determine food deserts (areas with low access to grocery stores) for nonprofit organization Urban Habitat Chicago, and using the derived information to find available city land suitable for community gardens or other urban agriculture-based initiatives.
|
||||
|
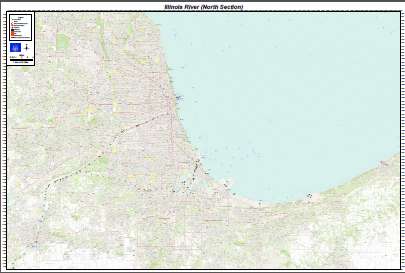
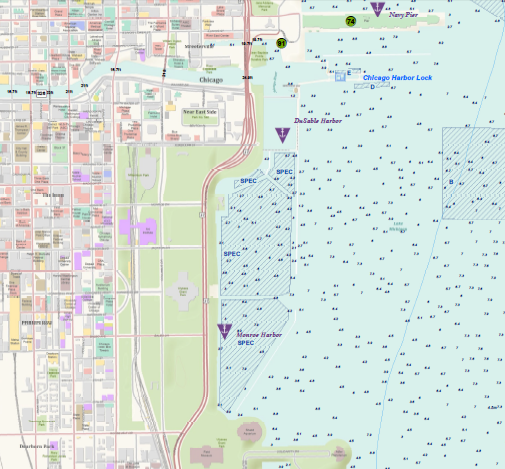
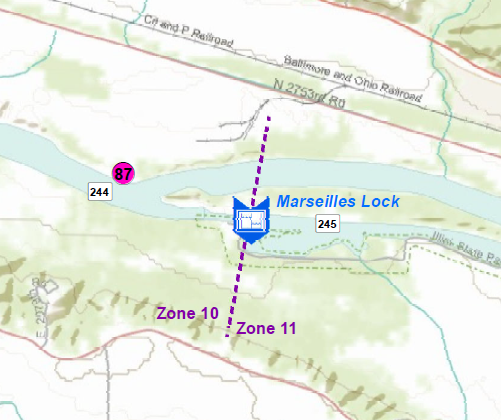
Capstone Partnership, U.S. Coast Guard, Marine Safety Unit Chicago
|
Initial Class partnership and success, Real project experience First GIS class to establish ongoing partnership with nearby Coast Guard unit needing GIS work.
-Production of several map products pertaining to client workflow: Two 12 X 8 foot wall maps of primary river systems in topographic, several imagery enlargements of harbors and other discretionary facilities related to USCG jurisdiction, topo enlargements of other areas such as downtown Chicago -The processing, management, and collection of inherited data, created data -Processing of data in several ISO and FCC coding standards for inland marine navigation data -Creation of custom symbols and labeling scripts -Management of group time and in-house / out- of house resources such as software and plotting -Leveraging client needs and recommendation of needs -Managing project scope, scope creep -Staging presentation with heads of MSU Chicago and Dean, as well as handing off project to next class which will use work to create geo-PDF's / mapbooks / other data retrieval systems.
|
||||
|
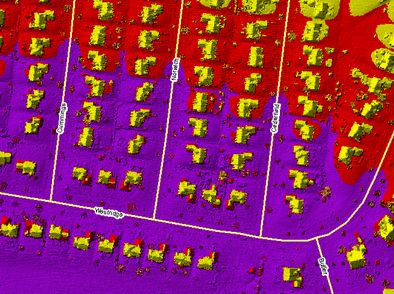
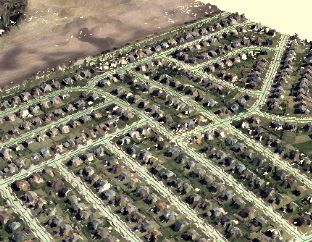
Solar Potential using LiDAR, DuPage County, IL (Working Capstone)
|
Working Project, LiDAR Processing, 3D Analysis, Terrain Datasets, Raster Processing, Slope and Aspect Analysis Ongoing (pet) project started as my capstone for a GIS certificate, which was delayed by commitment to a new class partnership with the Coast Guard.
Using newly available LiDAR data for DuPage county, IL, I plan to isolate the structures retrieved from raw .las files in order to calculate the amount of available roof area, the roof pitch (slope) and if it south-facing (aspect) and then use the results to calculate how many solar panels could potentially be installed, and energy saved. Further, I'd like to isolate the most potential candidate roofs, or categorize buildings by their use – commercial, government, and residential by some spatial proximity method to select geocoded business because there are different approaches to suggesting solar panel installation depending on the property.
Project Update: Many different approaches have been tried thus far, some adequate in a larger scale, but not adequate to the automated production of clean urban models yet. Extensive research into multiple methods, the building of my own computer system with ArcInfo v.10 licensing, has kept this project going, and interesting for the last few months. The potential for using models to further “automated computer vision” of the raw input data is still here. Methods and Approaches to date: -Basic quadratic simplification: Good for cleaning, inadequate for QAQC, as well as irregular building shapes -Hydrological Analysis: Modeling water to determine flow concentrations along roof edges, so far some success -Remote Sensing Data: not enough publicly available at a comparable resolution to the LiDAR, some potential with just RGB signatures. -Planar Fitting: finding trends among point clusters – geoprocessing and interpolation tools must be examined, as well as processing power / temperature issues -Scripted Editing commands in VB considered to “trace” select shapes / best fit.
|
||||
|
|
|
||||
|
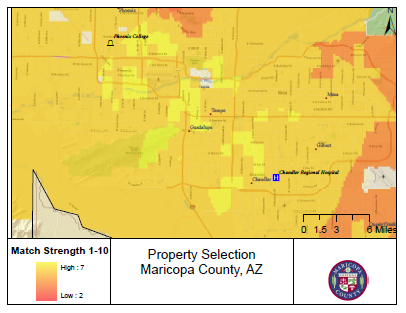
Locational Decisions, Maricopa County, AZ
|
Locational Decisions, Spatial Analysis, Raster Mathematics, Proximity and Weighted Overlay Hypothetical scenario helping a couple find a neighborhood to look for a home based on criteria they listed. Surfaces were created from scratch based on distances from work, the desired high housing values, and target age group. The surfaces, or “heat maps” were then overlayed in a model to create a final heat map showing the perfect location based on criteria. Alternately, experimentation with weighting towards a specific characteristic was done to hone in on a desired area. The desired areas are shown as brighter (yellow) and darker (red) for the opposite. |
||||
|
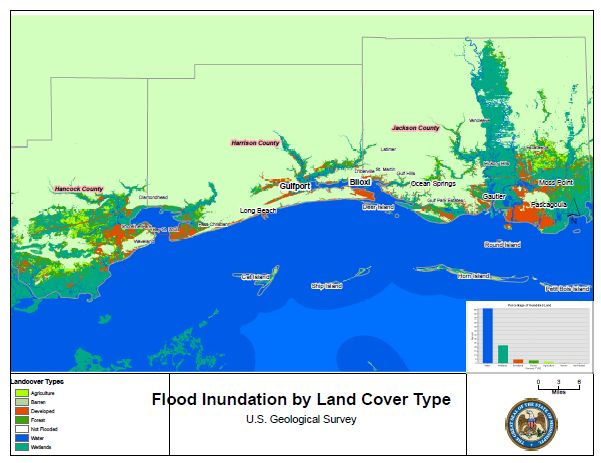
Katrina Flood Damage Decisions |
Raster mathematics, Dynamic Labeling – Spatial Analysis Classroom exercise using elevation and land-use surfaces to determine where and what percentage of different land-uses was affected after a given inundation level. Cultural instutions for safe evacuation were determined as well. |
||||
|
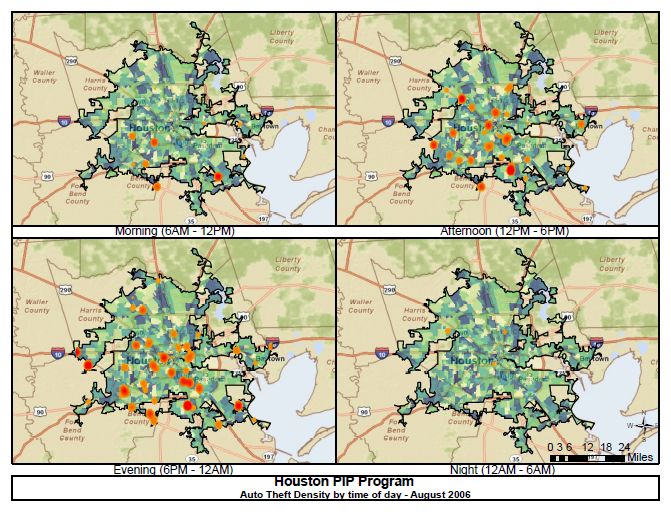
Houston Crime Density and Times |
Kernel Density, Geocoding, Temporal – Spatial Analysis Data from Houston's PIP (Positive Interaction Program), an open database of crimes in Houston with information about the general block and time the crime occurred was taken and geocoded with an adress locator, and kernel density was used to create maps showing higher densities of X crime around X time. Pictured to the left is a map of Grand Theft Auto crime density occuring during morning, afternoon, evening, and nighttime in the month of August. |
||||
|
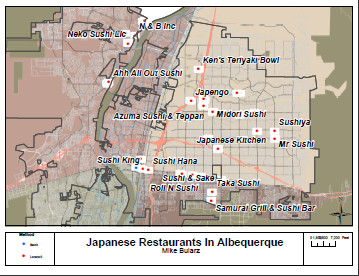
Sushi in Albuquerque |
Geocoding Base street centerlines and parcel data was obtained through the municipality’s web portal, sushi places found through Yellow Pages online, cleaned up the list in Excel, and then ran the addresses through a custom-made address locator. A second method was used for comparison, running the list of sushi places through a batch geocoding script online, and a map comparing the result was produced – they were similar other than that the address locator placed sushi places by their addresses along the street centerline and the online script placed them based on parcel data. Download PDF |
||||
|
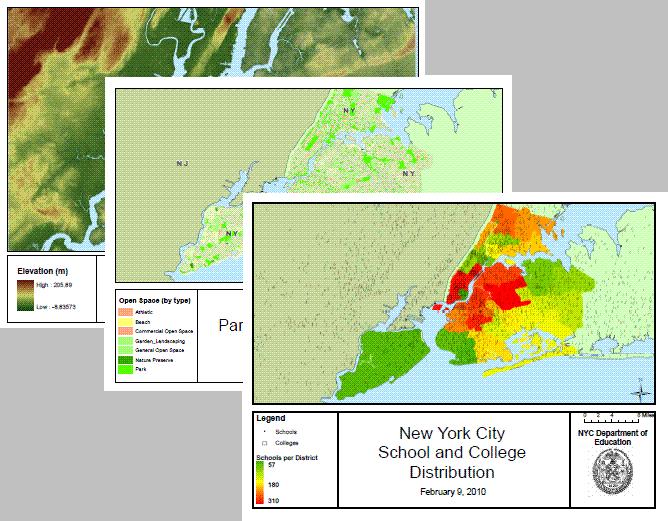
5 Views of NYC |
Cartography / Symbology Data from New York City Datamine as well as USGS hydrological data cleaned up and organized to show different aspects of the famous city. |
||||
|
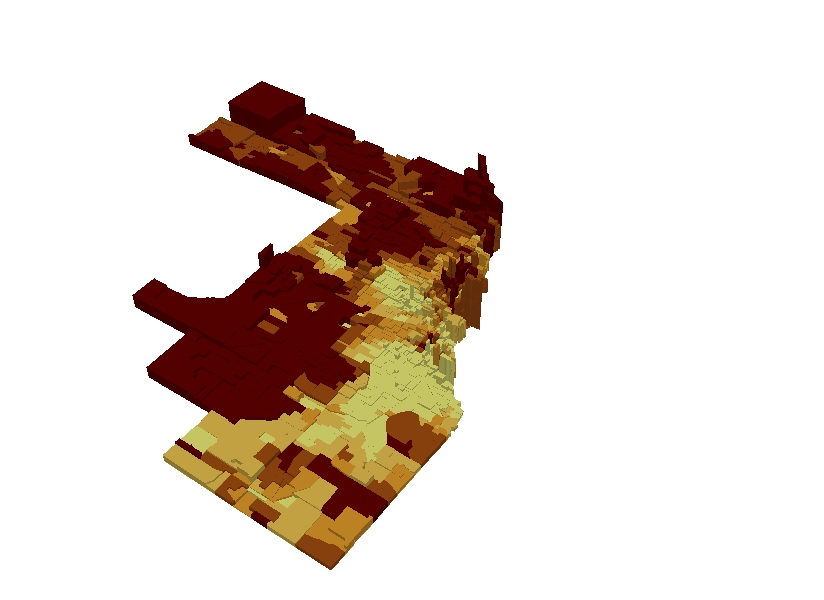
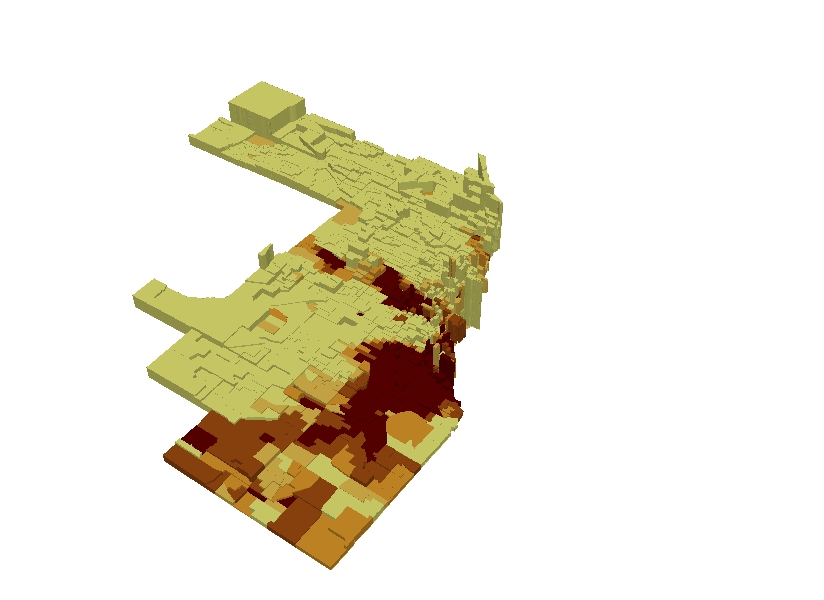
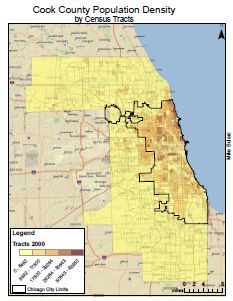
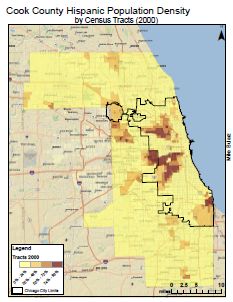
Chicago Diversity and Change |
Three-dimensional and Temporal (Visual Comparison) Census Population data from 1990 and 2000 used to display population density and ethnic diversity change over time, US Tiger data to show median housing values, normalized ethnic density maps, Diversity Index maps derived using the University of North Carolina method for fairly calculating diversity based on census questions from different years. Three dimensional maps to compare geographic distribution of median housing values vs. ethnicities or the DI (diversity index) in a double – variable map. |